
A FinOps-oriented executive report on how BI, semantic models, cloud data platforms, concurrency, autoscale, egress, and observability turn user interaction into multiplied backend cost.
Executive Summary
Interaction is the new unit of cloud cost.
Azure, Fabric, Power BI, and Databricks architectures are typically bought, budgeted, and discussed in terms of users, capacity, warehouses, and licenses. The bill is driven by something more granular: the number of billable backend events created when people open, filter, drill, refresh, and share information. The Phase 1 premise is blunt: cloud analytics cost is not driven by named users alone. It is driven by the physical compute, I/O, storage, network, autoscale, and telemetry events underneath each logical user action. [S1]
Table of Contents
- Executive Summary
- Medallion Architecture
- Cost-Driver Analysis
- Hidden Billing Layers
- Query Amplification
- Concurrency & Throttling
- Workload Simulations
- GUUT Economics
- FinOps Recommendations
- Architecture Review Questions
- Citations & Sources
| 550K | 1M | 95%+ | $3M to $11M |
|---|---|---|---|
| Monthly dashboard interactions | Monthly member interactions | Potential query suppression | Healthcare likely annual savings |
| Model expands this into 2.2M to 16.5M backend tasks. | Healthcare/payor model starts here before 10M analytical queries. | GUUT applies where recurring read-mostly delivery can be moved to generation. | Planning range before high-pressure upside cases. |
Core finding: Consumption amplification is not a pricing footnote. It is an architecture problem. Every dashboard click, filter, drilldown, row-level security check, source query, storage read, metadata call, autoscale event, egress event, and log entry can become part of the invoice. GUUT changes the equation by replacing repeated live-query delivery with scheduled generation and local interaction. [S2][S3]
Why this matters to executives
Budget variance is increasingly created by behavior that finance cannot see in the architecture diagram: concurrency, fan-out, cache misses, DirectQuery, semantic model recalculation, dashboard rendering, and telemetry ingestion. This makes cloud analytics hard to forecast even when the platform is well-engineered.
Why this matters to FinOps
The relevant question is no longer, “How many users do we have?” It is, “How many billable events are created per business interaction, and which of those events repeat the same work?” That is the workload unit this report uses.
Medallion Architecture Overview
The medallion pattern is logical. The invoice is physical.
A typical Azure analytics stack flows from source systems into raw storage, transformation layers, curated marts, semantic models, and dashboards. The architecture looks clean. Cost does not follow the diagram cleanly because metering crosses every layer: DBUs, VMs, Fabric CU-seconds, storage operations, metadata calls, networking, egress, gateway traffic, and logs.
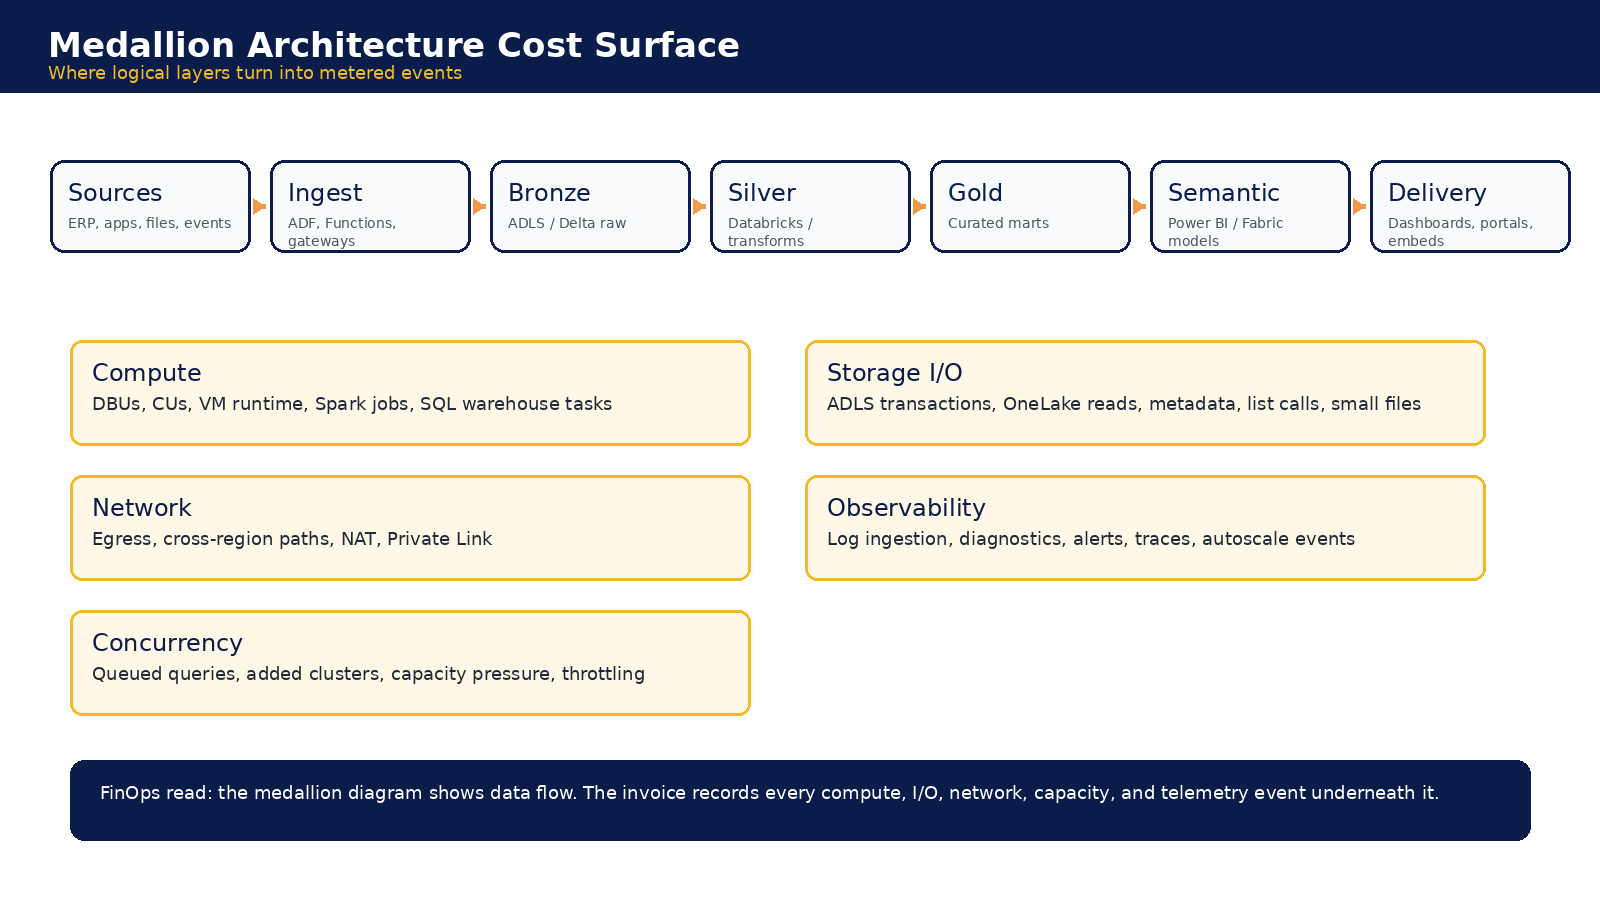
Figure 1. Logical layers show flow. Cost follows compute, I/O, network, capacity, concurrency, and telemetry events.
The important FinOps move is to treat the medallion architecture not as a static topology, but as an event generator. Report loads, refreshes, slicers, DirectQuery interactions, embedded sessions, and external portal access all cause activity that may land in different services and different billing abstractions.
Detailed Cost-Driver Analysis
The cost drivers are multiplied across services.
The following table frames the main cost drivers by what is metered, how amplification occurs, and what finance should monitor.
| Cost driver | Metered mechanism | Amplification pattern | FinOps implication |
|---|---|---|---|
| Semantic model and visuals | DAX or SQL queries, CU-seconds, cache lookups | Each visual can issue a query. Filters and slicers can re-issue many of them. | Model dashboard cost by interactions and visuals, not just by named users. |
| Databricks SQL | DBUs, VM runtime, warehouse scale-out, storage I/O | DirectQuery and live dashboards push repeated query work into Databricks. | Separate analyst exploration from repeated delivery workloads. |
| Fabric capacity | CU-seconds, burst smoothing, throttling, Spark and warehouse operations | Short spikes can consume future capacity and trigger operational pressure. | Capacity planning must include peak windows, not just monthly average usage. |
| Power BI capacity | Licenses, Premium or Embedded capacity, autoscale, semantic queries | Concurrent readers, visuals, and RLS reduce cache reuse and raise capacity pressure. | External and view-only users need a separate economic model. |
| ADLS / OneLake | Transactions, reads, writes, metadata, list calls, storage tiers | Small files and repeated scans create high operation counts even when data volume is modest. | Tune file layout and reduce repeated reads from delivery workloads. |
| Networking and egress | Outbound GB, NAT Gateway, Private Link, cross-zone and cross-region traffic | Repeated sessions move the same or similar intelligence many times. | Track payload path and frequency, not only total GB. |
| Monitoring and logs | GB ingested, retention, diagnostics, alerts | Every query, retry, refresh, failure, and autoscale event can create logs. | Log governance must follow workload governance. |
FinOps control rule: Map every user-facing interaction to the server-side events it triggers, then price each event separately. A dashboard view is not one event. It can become multiple DAX queries, DirectQuery calls, source database reads, storage reads, metadata checks, gateway traffic, capacity CU-seconds, egress, and logs. [S1]
Hidden Billing Mechanics
Vendor abstraction hides the resource path.
Microsoft and Databricks publish substantial documentation, but enterprise buyers still face opacity because the operational unit in the invoice is not always the business unit in the workload. DBUs, CUs, autoscale increments, throttling behavior, and log ingestion can hide the source of cost unless the customer performs workload-level attribution.
| Mechanic | How the bill appears | Why it is hard to govern |
|---|---|---|
| Databricks DBUs plus Azure VMs | Warehouse and cluster runtime, plus underlying compute, storage, network, and monitoring | DBUs feel like the unit of analysis, but VM time, idle runtime, autoscale nodes, and storage operations remain separate cost chains. |
| Fabric CU smoothing and throttling | Interactive operations, warehouse queries, Spark jobs, semantic model actions, OneLake reads and writes | A burst can consume future headroom. Sustained overuse becomes delay, throttling, capacity upgrade pressure, or autoscale exposure. |
| Power BI Premium autoscale | Added capacity when demand exceeds provisioned capacity | The buyer may think capacity is fixed, but peak concurrency can create new billable capacity events. |
| ADLS and Delta storage operations | Transactions, metadata calls, file opens, list operations, VACUUM, and small-file amplification | Data volume is only part of the cost. File count, partition layout, and maintenance operations can multiply events. |
| Azure networking and egress | Outbound GB, cross-region paths, NAT Gateway hours and GB, Private Link endpoint hours and GB | Private networking does not automatically mean free networking. The path matters as much as the destination. |
| Azure Monitor and Log Analytics | GB ingested, retention, alerts, exported logs, diagnostic settings | Every backend event can generate telemetry. Observability becomes a secondary cost amplifier. |
| DBU opacity | CU opacity | Observability drag |
|---|---|---|
| Databricks cost is not just DBUs. Running clusters also carry VM cost, storage cost, network cost, and monitoring cost. Idle clusters and autoscale-added nodes can become silent cost sources. [S1] | Fabric work consumes CU-seconds across interactive operations, semantic models, warehouses, Spark, dataflows, and OneLake. Bursts can create throttling or capacity pressure that is not obvious at design time. [S1] | Log ingestion follows backend activity. If every query creates telemetry, then query amplification becomes monitoring amplification. GUUT only reduces this where backend events are actually removed. [S1][S3] |
Query Amplification Analysis
A dashboard click is not a query. It is a query generator.
Power BI pages can contain many visuals. Each visual can issue at least one semantic query. Each semantic query may hit imported data, Direct Lake, DirectQuery, Databricks SQL, Synapse, OneLake, ADLS, or another source. Security filters and RLS reduce cache reuse. Retries, refreshes, and preview behavior add more work. The user sees one click. The cloud bill records a chain.
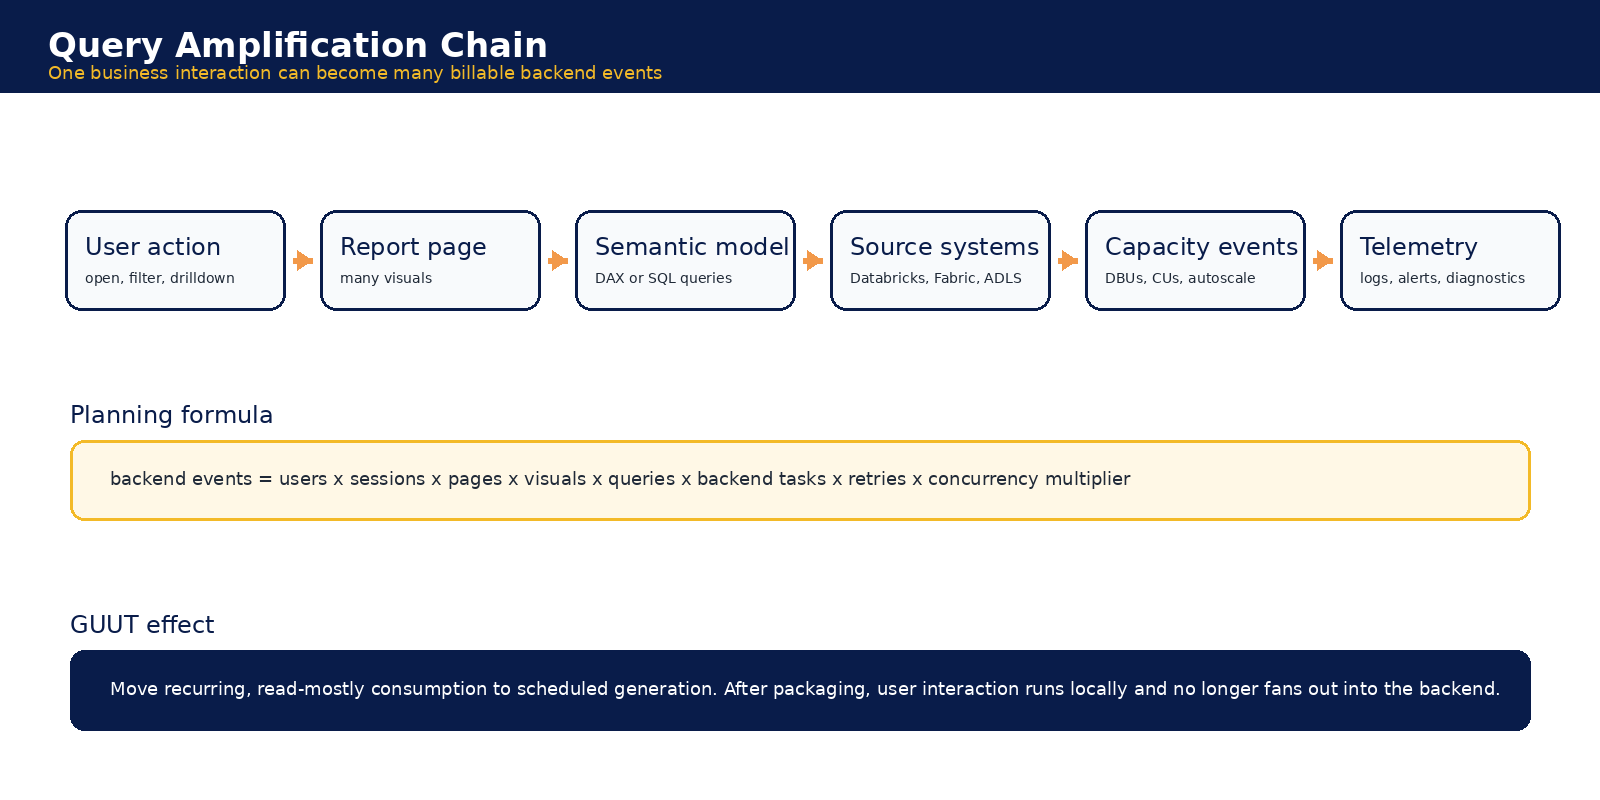
Figure 2. Consumption amplification begins when a business interaction fans out into semantic, source, storage, capacity, network, and telemetry events.
The first executive mistake is to ask whether a dashboard has the right license. The harder question is whether the architecture forces the cloud to recalculate, render, move, and log the same intelligence every time someone explores it.
Concurrency and Autoscaling Economics
Monthly averages hide the cost event.
Concurrency is the accelerant. A workload can look controlled on a monthly average while still forcing Databricks SQL warehouses, Fabric capacity, and Power BI capacity to scale, throttle, or queue under peak demand. Autoscale is useful operationally, but it can turn user behavior into an uncontrolled financial variable.
| Traditional model | GUUT model |
|---|---|
| Peak users generate simultaneous report loads, semantic queries, DirectQuery calls, warehouse activity, storage reads, egress, and logs. If capacity is insufficient, the platform scales, throttles, or delays. | Scheduled generation creates the intelligence before consumption. Recipients filter, compare, and drill locally. Peak readership no longer equals peak backend query pressure. |
Planning rule: Autoscale risk is driven by peak concurrent sessions, not total named users. FinOps modeling must include events such as board reviews, billing cycles, EOB releases, month-end close, regulatory reviews, and open enrollment. [S1][S2]
Workload Simulation Sections
Two scenarios, one economic pattern.
The Phase 2 models intentionally keep the interactive dashboard and healthcare/payor simulations separate. The shared pattern is the same: the business sees users and interactions, while the cloud bill sees multiplied backend events. [S2]
Workload scale comparison
| Metric | Interactive Dashboard Simulation | Healthcare / Payor Workload Simulation |
|---|---|---|
| Population | 500 named users | 100,000 covered members |
| Interaction pattern | 50 actions per user per business day | 10 interactions per member per month |
| Monthly interactions | 550,000 | 1,000,000 |
| Base backend query logic | Visual, semantic, and source query fan-out | 10 backend analytical queries per member interaction |
| Monthly backend query or task volume | 2.2M to 16.5M backend tasks | 10M analytical backend queries |
| Secondary semantic query load | 4M to 7M semantic queries | 10M to 100M semantic, DAX, or visual query events |
| Peak multiplier | 3x to 6x average | 5x to 20x normal traffic around EOBs, claims, notices, open enrollment, and campaigns |
| Main risk driver | High-frequency internal dashboard usage | Bursty external or member-facing demand plus RLS and PHI audit overhead |
Conventional architecture exposure
| Exposure area | Interactive Dashboard Simulation | Healthcare / Payor Workload Simulation |
|---|---|---|
| DBU exposure | 1,500 to 45,000 DBUs per month | 75K to 1.8M DBUs per month |
| Fabric CU exposure | 5.5M to 55M CU-sec per month | 20M to 600M CU-sec per month |
| Power BI pressure | 50 to 125 concurrent users and 20 to 50+ semantic queries per second at peak | A5 or F64 to A7 or F256+ class implications in higher-load cases |
| Storage transaction exposure | 22M to 1.2B+ ADLS or OneLake operations per month | 100M to 1B+ ADLS or OneLake operations per month |
| Egress exposure | 140 GB to 1.1 TB client-facing, plus 0.5 TB to 5 TB backend paths | 0.3 TB to 15 TB internet or application egress |
| Monitoring and logging exposure | 25 GB to 2 TB+ Monitor or Log Analytics ingestion per month | 50 GB to 5 TB+ monitoring or log ingestion per month |
| Autoscale and throttling risk | Databricks cluster scaling, Fabric smoothing, throttling, and Power BI autoscale minimums | Warehouse cluster additions, Fabric CU pressure, Power BI Premium autoscale, and Embedded under-provisioning |
Cost range comparison
| Cost range | Interactive Dashboard Simulation | Healthcare / Payor Workload Simulation |
|---|---|---|
| Conservative monthly | $11K to $30K | $91K to $290K |
| Likely / base monthly | $30K to $75K | $340K to $1.13M |
| High-pressure monthly | $75K to $160K | $1.28M to $3.45M |
| Conservative annual | $132K to $360K | $1.1M to $3.5M |
| Likely / base annual | $360K to $900K | $4.1M to $13.6M |
| High-pressure annual | $900K to $1.92M | $15.4M to $41.4M |
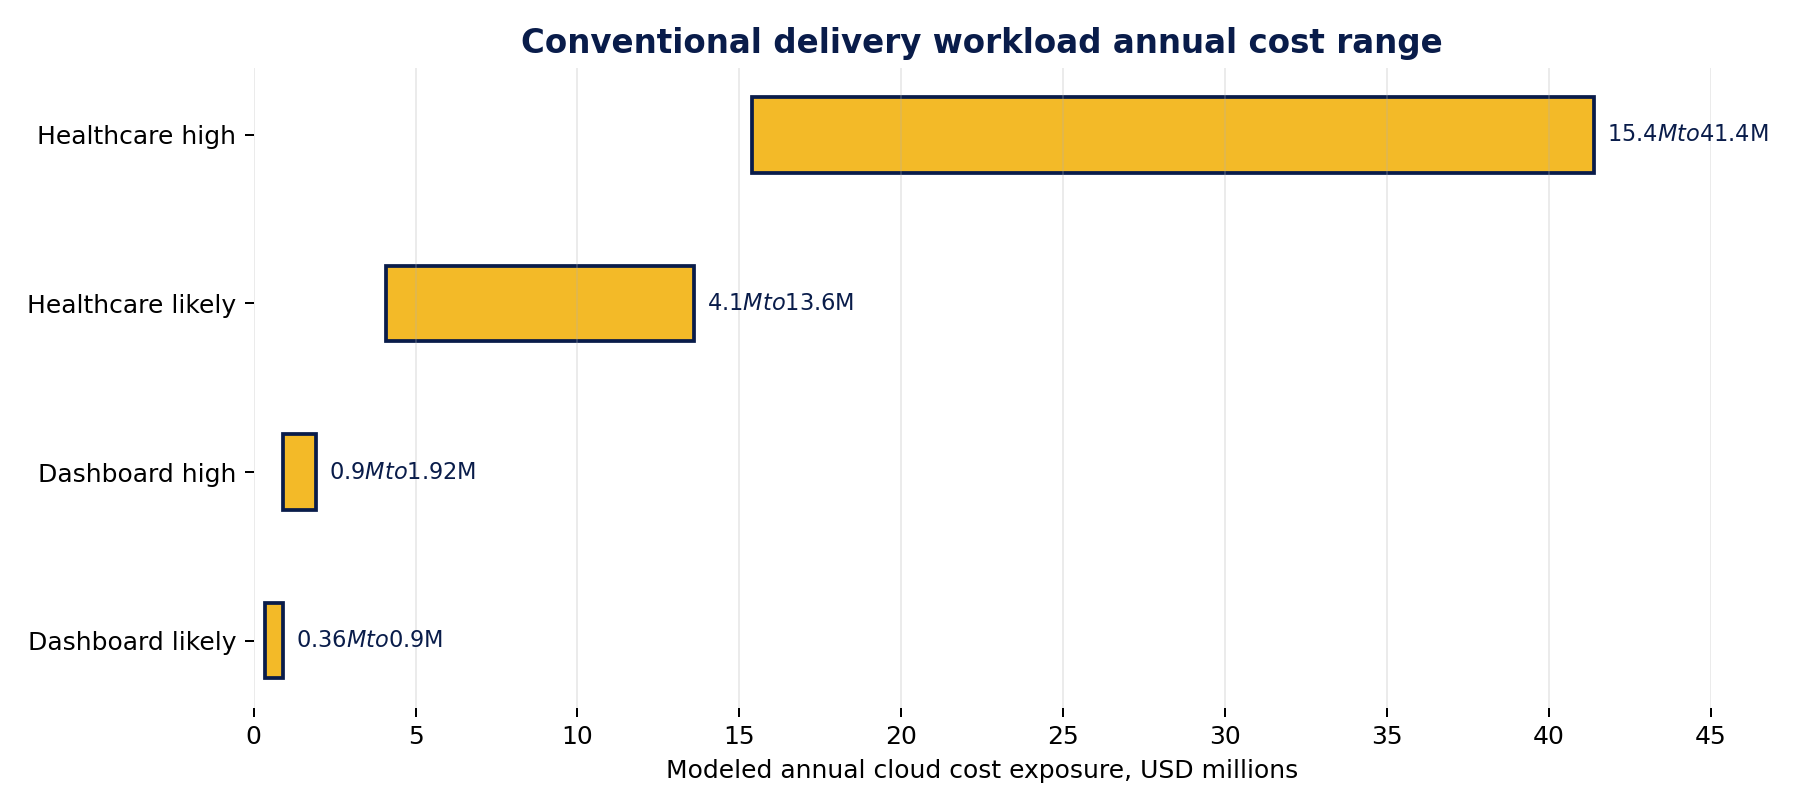
Figure 3. Modeled annual conventional delivery workload exposure. Values are planning estimates from the source workload models, not audited customer bills.
Scenario interpretation
| Interactive dashboard scenario | Healthcare/payor scenario |
|---|---|
| The 500-user dashboard starts with 550,000 monthly interactions and expands into 2.2M to 16.5M backend tasks. The high-pressure annual exposure reaches $900K to $1.92M because high-frequency internal usage concentrates semantic queries, DBUs, CUs, storage operations, monitoring, egress, and autoscale risk. | The 100,000-member workload starts with 1M monthly interactions and 10M analytical backend queries before secondary amplification. RLS, PHI audit overhead, personalization, embedded delivery, and burst behavior can push the annual exposure into the tens of millions in high-pressure conditions. |
GUUT Comparative Economics
GUUT changes the workload shape.
GUUT does not make DBUs, CUs, egress, or logs disappear from the enterprise. It changes when and why they occur. The expensive backend work happens during scheduled generation. After the InfoApp is delivered, filtering, drilling, comparing, and exploring run locally against scoped data and embedded logic. [S3]
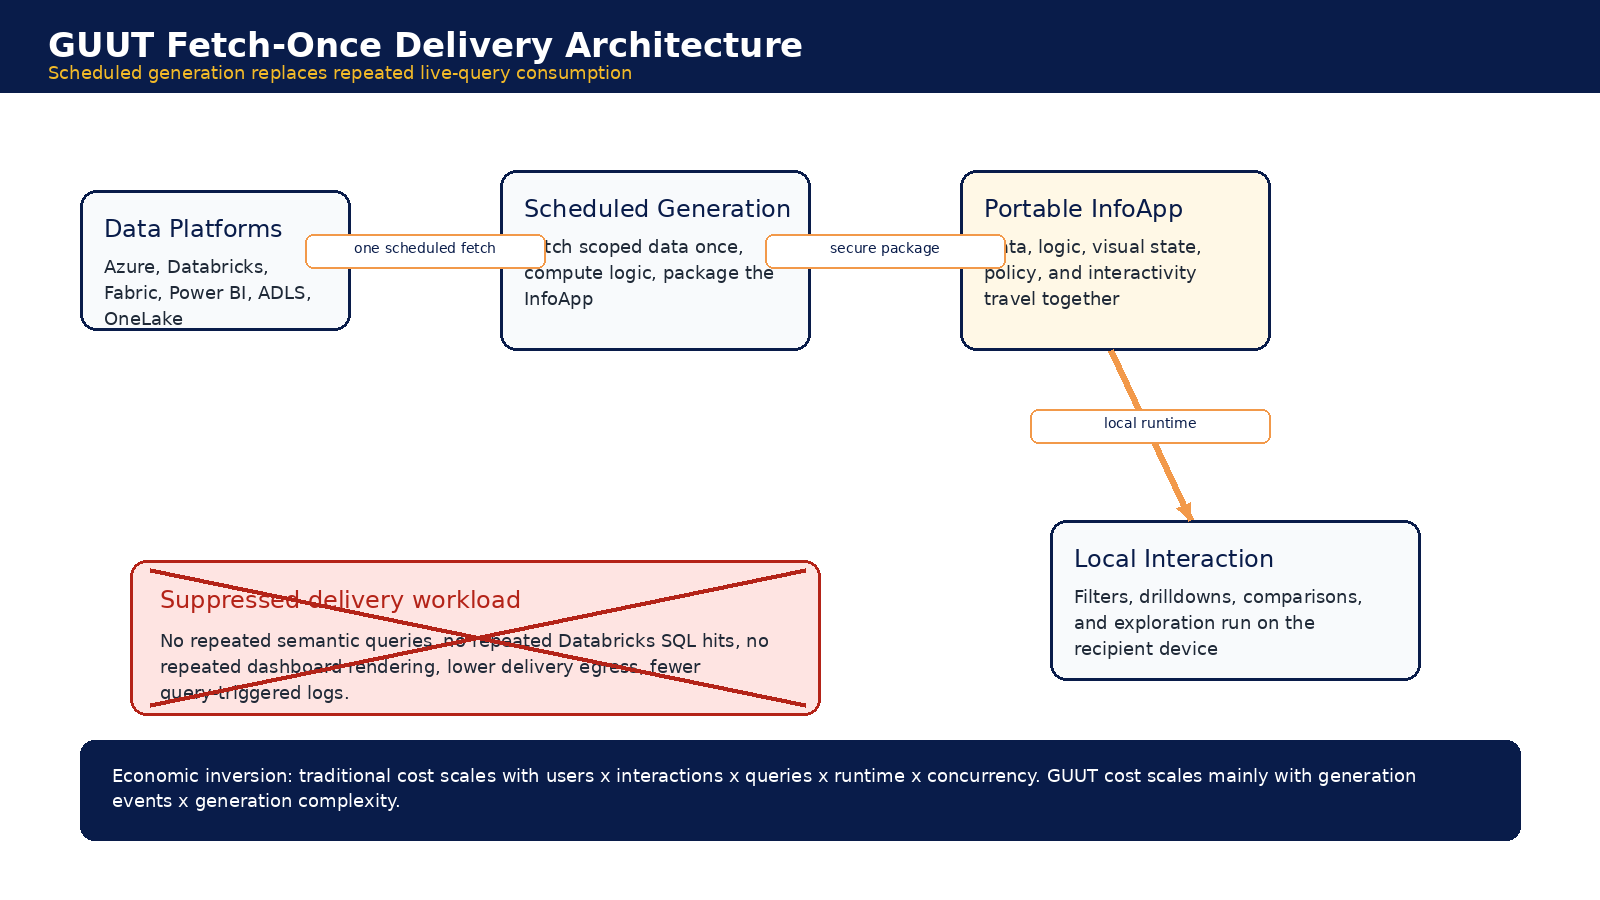
Figure 4. Fetch-once delivery shifts consumption from live user interaction to scheduled generation and local execution.
GUUT modeled suppression comparison
| GUUT impact area | Interactive Dashboard Simulation | Healthcare / Payor Workload Simulation |
|---|---|---|
| Server-side interaction queries after GUUT | Near zero | 0 at consumption layer |
| Scheduled generation workload | 22K to 55K generation queries per month | 50K to 500K generation queries per month |
| Net backend query reduction | 85% to 95% planning reduction, 97% to 99% before exceptions | 95% to 99.5% |
| Databricks DBU reduction | 40% to 75% of delivery-layer Databricks spend | 70% to 95% |
| Fabric CU suppression | 70% to 95% of consumption-layer CUs | 75% to 95% |
| Power BI capacity pressure reduction | 50% to 80% of autoscale or overage component | 60% to 95% |
| Semantic model query reduction | 85% to 98% | 80% to 98% |
| ADLS / OneLake operation reduction | 60% to 90% of delivery-driven operations | 70% to 95% |
| Egress reduction | 50% to 90% | 40% to 90% |
| Monitoring and logging reduction | 10% to 35% total Monitor reduction, higher for user-triggered logs | 50% to 90% for interaction or query-driven logs |
| Autoscale and burst suppression | 50% to 80% of overage or autoscale exposure | 70% to 100% |
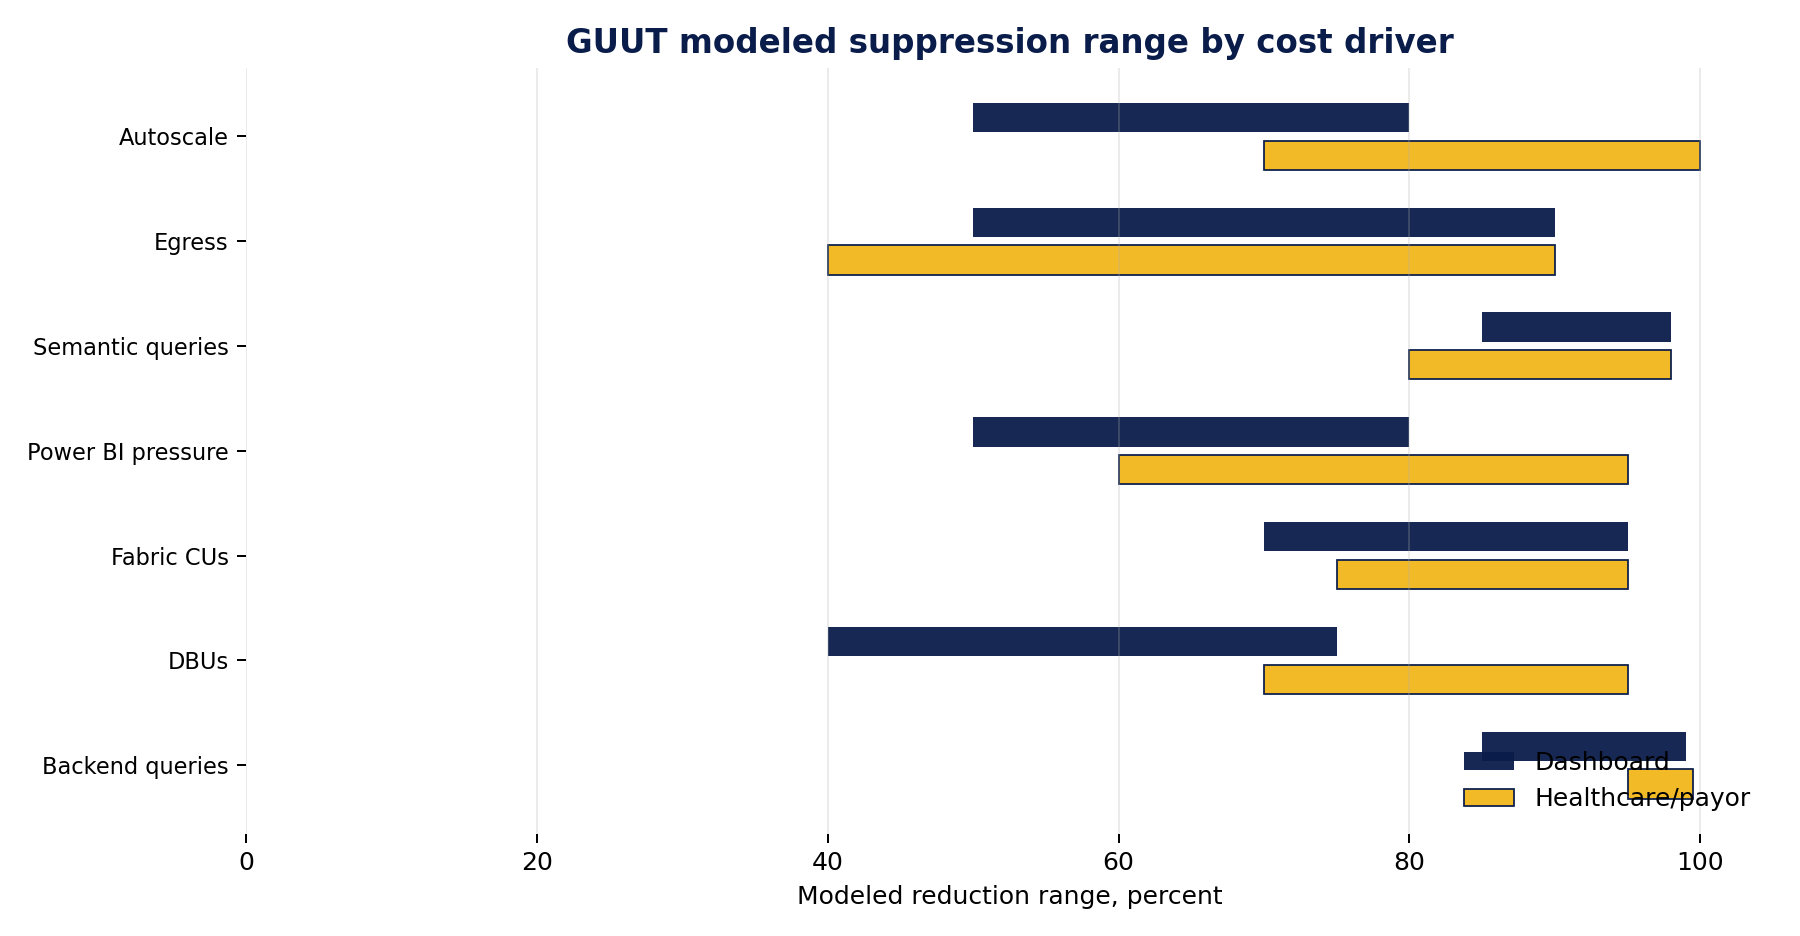
Figure 5. Modeled GUUT suppression ranges by cost driver for the dashboard and healthcare/payor scenarios.
Savings comparison
| Savings metric | Interactive Dashboard Simulation | Healthcare / Payor Workload Simulation |
|---|---|---|
| GUUT-adjusted conservative monthly | $6K to $18K | $34K to $430K total residual cloud workload |
| GUUT-adjusted base monthly | $12K to $30K | $34K to $430K total residual cloud workload |
| GUUT-adjusted high monthly | $25K to $65K | $34K to $430K total residual cloud workload |
| Conservative annual savings | $60K to $144K | $0.7M to $2.3M |
| Base / likely annual savings | $216K to $540K | $3.3M to $10.6M |
| High-pressure annual savings | $600K to $1.14M | $13.9M to $36.2M |
| CFO-facing planning range | $216K to $1.14M likely annual savings depending on amplification | $3M to $11M likely annual savings, with $14M to $36M possible in high-pressure environments |
CFO message: Stop paying the cloud every time someone looks at the same intelligence. Generate it once. Govern it. Distribute it. Let users interact locally.
Where GUUT does not save money
A credible FinOps argument needs boundaries. GUUT does not eliminate upstream ETL, base storage, mandatory security logging, compliance logging, analyst authoring workloads, original generation cost, transactional system load, or real-time operational analytics. The savings come from removing the repeated live-query delivery pattern after generation. [S2][S3]
FinOps Implications and Optimization Opportunities
Cost predictability is the strategic benefit.
Traditional FinOps often responds after consumption: anomaly detection, budget alerts, tagging, reservations, rightsizing, and workload tuning. Those disciplines remain necessary. GUUT adds a more structural control: suppressing repeated delivery-layer consumption before it reaches the invoice.
| Opportunity | What to do | Why it matters |
|---|---|---|
| Classify workloads by intent | Separate live analyst exploration, operational monitoring, recurring executive packages, external reporting, and member or customer statements. | Not every dashboard should become an InfoApp, but every recurring read-mostly output should be challenged. |
| Measure interaction-to-query ratios | Instrument report opens, pages, visuals, slicers, DirectQuery calls, retries, cache misses, storage operations, and telemetry volume. | The amplification ratio is the missing FinOps unit. |
| Move repeated delivery to generation cadence | Precompute scoped outputs on a schedule, package interaction logic, and deliver through a governed InfoApp. | This is where server-side consumption can be structurally removed. |
| Govern concurrency as a cost driver | Model peak users, not just monthly users. Stress-test EOBs, board cycles, billing cycles, and open enrollment windows. | Peak concurrency is where autoscale, throttling, and emergency capacity spending appear. |
| Tune storage and semantic layers | Reduce small files, prune partitions, manage DirectQuery fan-out, and design semantic models for cache reuse. | GUUT helps after generation. The source platform still needs solid engineering. |
| Create a delivery-layer chargeback model | Track cost per delivered report, cost per interaction, cost per external user, and cost per scheduled generation run. | Finance needs a unit economics model that matches how the workload actually bills. |
| Forecast spend | Attribute cost | Reduce opacity |
|---|---|---|
| Replace user-driven backend variance with scheduled generation windows that can be measured, tested, and governed. | Move from blended capacity charges to cost per generated InfoApp, cost per distribution cadence, and cost per avoided interaction. | GUUT does not make vendor billing transparent. It reduces how often recurring delivery workloads touch the opaque units. |
Questions for Microsoft and Databricks
Questions every buyer should ask before renewing capacity.
The goal is not to accuse vendors of bad behavior. The goal is to force cost attribution to match workload behavior. If the vendor cannot answer at the interaction level, the customer cannot govern at the workload level.
| Topic | Question for Microsoft or Databricks |
|---|---|
| Fabric CUs | How many CU-seconds did each report, visual, semantic query, Direct Lake read, Spark operation, and OneLake operation consume in the last billing period? |
| Capacity smoothing | How is burst consumption applied across the smoothing window, and what specific activity caused throttling or future headroom consumption? |
| Power BI autoscale | Which report sessions and semantic queries triggered autoscale, and how long did added capacity remain billable? |
| DBU attribution | Can Databricks provide per-query DBU and VM cost attribution by dashboard, warehouse, user group, and source table? |
| DirectQuery fan-out | How many source queries are generated per Power BI visual, slicer change, drilldown, and page refresh? |
| OneLake and ADLS operations | Which reports or queries are generating the most metadata, list, open, read, and transaction activity? |
| RLS overhead | How much capacity is consumed by row-level security evaluation and reduced cache reuse in personalized workloads? |
| Monitoring charges | How much log ingestion is directly tied to user-triggered query activity versus mandatory security and platform diagnostics? |
| Egress paths | Which user-facing workloads generate internet egress, cross-region traffic, NAT Gateway processing, or Private Link charges? |
| Commercial accountability | Can vendor invoices show cost per business interaction, not only cost per proprietary unit? |
Methodology and Inference Notes
How to read the estimates.
Note: The cost ranges remain planning estimates derived from source workload models and should be revalidated before customer-specific pricing, procurement, or contractual use.
The workload figures and savings ranges are planning estimates from the prior research sections and simulations. They are not audited billing outcomes. Ranges apply to addressable delivery-layer workloads, not total enterprise cloud spend. The analysis assumes recurring, distributable, read-mostly intelligence where live interaction can be replaced by scheduled generation and local execution.
The report does not assume GUUT replaces all Power BI, Fabric, Databricks, or Azure usage. Analyst exploration, real-time dashboards, operational monitoring, data engineering pipelines, and transactional systems may remain live workloads. Where this report uses phrases such as workload suppression architecture, query amplification reduction architecture, concurrency reduction architecture, egress suppression architecture, or FinOps governance architecture, those labels are strategic positioning inferred from the Phase 1, Phase 2, and Phase 3 materials. [S1][S2][S3]
Citations Section
Source context and official links.
The primary analysis is based on the three attached phase documents. Official links are included because pricing mechanics and metering rules change and should be revalidated before external publication or customer-facing modeling.
| Reference # | Link/Document | Description |
|---|---|---|
| S1 | Findings_Summary_Original_v2.docx (internal) | Core Azure, Databricks, Fabric, Power BI, storage, networking, monitoring, concurrency, and workload modeling findings |
| S2 | Comparative_Findings_Summary_v1.docx (internal) | Interactive dashboard and healthcare/payor workload simulations, cost ranges, GUUT suppression estimates, and savings ranges. |
| S3 | Phase 3 -GUUT_Cloud_Economics_Strategic_Analysis_v1.docx | GUUT positioning as workload suppression, query amplification reduction, concurrency reduction, egress suppression, and FinOps governance architecture. |
| L1 | Azure Databricks workload type and billing context | https://learn.microsoft.com/en-my/answers/questions/131489/azure-databricks-workload-type |
| L2 | Azure Bandwidth pricing | https://azure.microsoft.com/en-us/pricing/details/bandwidth/ |
| L3 | Azure NAT Gateway pricing | https://azure.microsoft.com/en-us/pricing/details/azure-nat-gateway/ |
| L4 | ADLS Gen2 billing FAQ | https://azure.github.io/Storage/docs/analytics/azure-storage-data-lake-gen2-billing-faq/ |
| L5 | Azure Monitor pricing | https://azure.microsoft.com/en-us/pricing/details/monitor/ |
| L6 | Azure Functions pricing | https://azure.microsoft.com/en-us/pricing/details/functions/ |
| L7 | Power BI pricing | https://www.microsoft.com/en-us/power-platform/products/power-bi/pricing |
| L8 | Power BI Embedded pricing | https://azure.microsoft.com/en-us/pricing/details/power-bi-embedded/ |
| L9 | Fabric throttling | https://learn.microsoft.com/en-us/fabric/enterprise/throttling |
| L10 | Fabric workload management | https://learn.microsoft.com/en-us/fabric/data-warehouse/workload-management |
| L11 | OneLake consumption | https://learn.microsoft.com/en-us/fabric/onelake/onelake-consumption |
| L12 | Direct Lake overview | https://learn.microsoft.com/en-us/fabric/fundamentals/direct-lake-overview |
| L13 | Fabric operations | https://learn.microsoft.com/en-us/fabric/enterprise/fabric-operations |
| L14 | Power BI Premium autoscale | https://learn.microsoft.com/en-us/fabric/enterprise/powerbi/service-premium-auto-scale |
| L15 | Fabric Spark autoscale billing | https://learn.microsoft.com/en-us/fabric/data-engineering/autoscale-billing-for-spark-overview |
| L16 | Fabric cost optimization | https://learn.microsoft.com/en-us/azure/well-architected/microsoft-fabric/cost-optimization |
| L17 | Databricks SQL warehouse scaling behavior | https://learn.microsoft.com/en-us/azure/databricks/compute/sql-warehouse/warehouse-behavior |
Public. Approved for public visibility and distribution.
Copyright 2026 GUUT, Inc. All rights reserved.