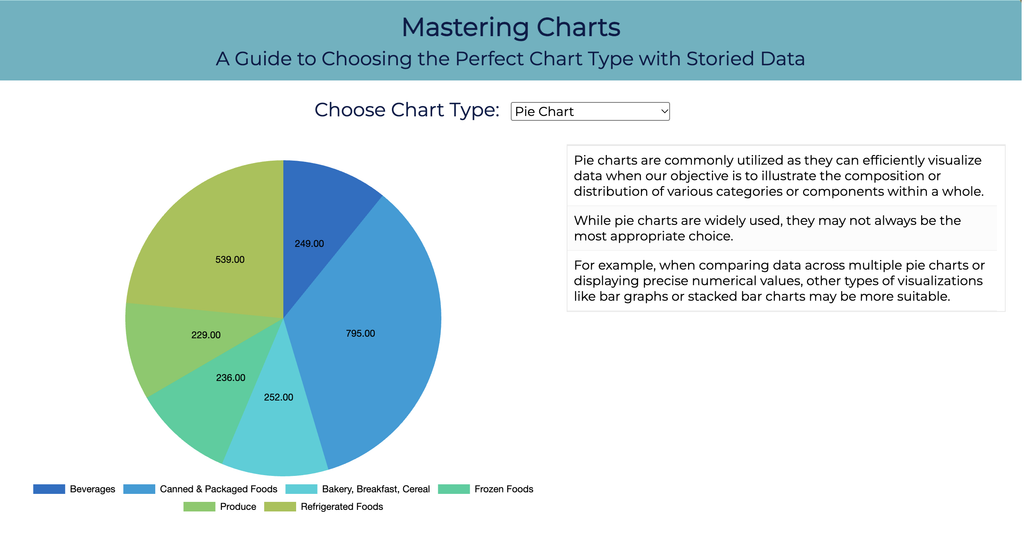
Not sure which chart to use? Compare different chart types available in Storied Data and learn when each one works best.
Pick a chart type to learn which chart type is the perfect chart for your data. This guide covers most chart types available in the designer workbench, including: pie, donut, line, bar, column, area, scatter plot, bubble, and mixed charts, plus the stacked versions of line, bar, column, and area charts.
Click below for the instructions: