
Hit enter to search or ESC to close
Close Search
Create and distribute smart, data-rich content with our interactive, portable InfoApps.
search
Menu
  • Why GUUT
  • INFOAPPS
    • Inside GUUT InfoApps
    • GUUT for Data Product Managers
    • Fun Tips for Data Product Managers
  • PLATFORM
  • SOLUTIONS
    • Our Solutions
    • Interactive Statements
    • Interactive Invoices
    • Digital XHTML Signatures
    • GUUT BI
    • AI Data Factory for Banking and Finance
    • Marketing Ready
  • Free Trial
  • BLOG
  • ABOUT
  • search
  • Menu
betterdocs-category-icon

Getting Started

2
  • Getting to know the user interface
  • Copy or move elements between tabs and containers
betterdocs-category-icon

Text

4
  • Dynamic Field Calculations
  • Paragraph
  • Dynamic Field
  • Static Text
betterdocs-category-icon

Charts

6
  • Column Chart
  • Donut Chart
  • Pie Chart
  • Creating Drilldown Chart
  • Choosing the right chart
  • Line Chart
betterdocs-category-icon

Images

2
  • How to set descriptions for the images in carousel
  • Create circular border around an image
betterdocs-category-icon

Data

1
  • Creating a Calculated/Derived Column
betterdocs-category-icon

Data Filters

4
  • Mutually Exclusive Filters
  • Switching Between Various Filter Controls
  • List Data Filter Controls
  • How to Create a Filter
betterdocs-category-icon

Generation

1
  • Generating HTML-Only Document
betterdocs-category-icon

Function

6
  • How to Use the Goto Page Function
  • How to Use the Select Tab Function
  • Toggle Container
  • Hide Container
  • Show Container
  • How to Add a Reset Filters Button
View Categories
  • Home
  • Manual
  • Charts
  • Line Chart

Line Chart

A line chart is a graphical representation that displays data points connected by straight or curved lines. A line chart is typically used to show trends over time or continuous changes in a dataset over a specified period. This guide will walk you through how to create a line chart and how to customize it.

Click below for the instructions:
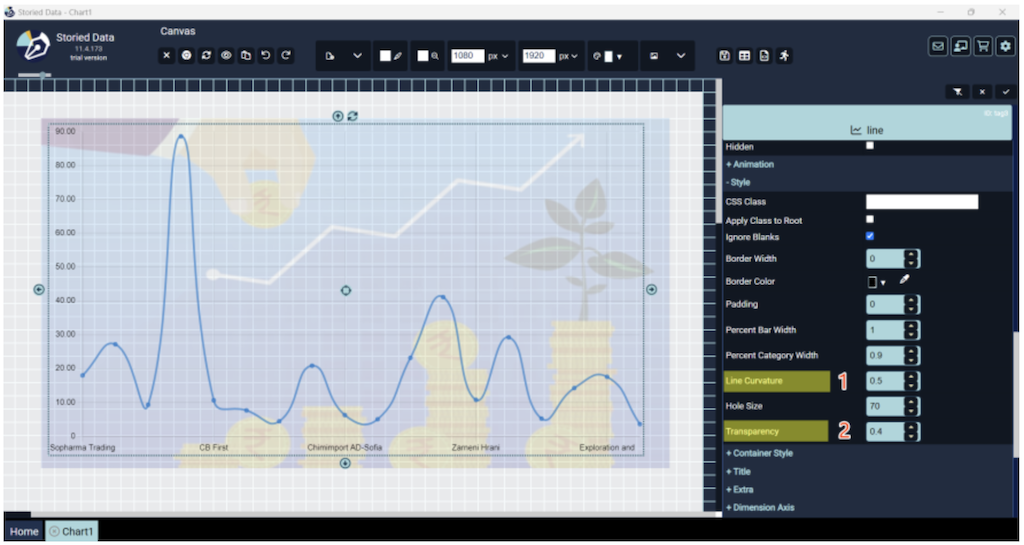
Open the instructions.

Still stuck? How can we help?

How can we help?

Choosing the right chartColumn Chart

GUUT: The Digital Gutenberg™

Privacy Policy

Terms & Conditions

Contact us

© 2026 All Rights Reserved

Close Menu
  • Why GUUT
  • INFOAPPS
    • Inside GUUT InfoApps
    • GUUT for Data Product Managers
    • Fun Tips for Data Product Managers
  • PLATFORM
  • SOLUTIONS
    • Our Solutions
    • Interactive Statements
    • Interactive Invoices
    • Digital XHTML Signatures
    • GUUT BI
    • AI Data Factory for Banking and Finance
    • Marketing Ready
  • Free Trial
  • BLOG
  • ABOUT
  • FAQ
  • Privacy Policy
  • Terms & Conditions